How to Monitor MySQL Using Zabbix
This tutorial will show you all the steps required to Monitor MySQL Using Zabbix 4.
This tutorial was tested on Ubuntu 18.04.
This tutorial was tested on Zabbix 4.0.3.
1. Configure a MySQL user to Zabbix
Zabbix requires an account to access the MySQL server and perform the database monitoring.
On the MySQL database server, create an account to Zabbix.
Give usage privilege over all MySQL databases to the Zabbix user.
CREATE USER ‘zabbix_monitor’@’%’ IDENTIFIED BY ‘kamisama123’;
GRANT USAGE ON *.* TO ‘zabbix_monitor’@’%’;
FLUSH PRIVILEGES;
quit;
Take note of the MySQL username and password created.
2. Install the Zabbix Agent on the MySQL Server
Now, we need to install the Zabbix agent on the computer running the MySQL service.
On the Linux console, use the following commands to install the required packages.
# groupadd zabbix
# useradd -g zabbix -s /bin/bash zabbix
# apt-get update
# apt-get install build-essential libpcre3-dev
Download the Zabbix installation package.
# mkdir /downloads
# cd /downloads
# wget https://ufpr.dl.sourceforge.net/project/zabbix/ZABBIX%20Latest%20Stable/4.0.3/zabbix-4.0.3.tar.gz
Extract the Zabbix installation package, compile and install the Zabbix agent.
# tar -zxvf zabbix-4.0.3.tar.gz
# cd zabbix-4.0.3/
# ./configure –enable-agent
# make
# make install
Copy the Startup scripts included on the Zabbix package.
# cd /downloads/zabbix-4.0.3/
# cp misc/init.d/debian/zabbix-agent /etc/init.d/
Find the location of the zabbix_agentd.conf configuration file on your system.
# updatedb
# locate zabbix_agentd.conf
# vi /usr/local/etc/zabbix_agentd.conf
Here is the original file, before our configuration.
LogFile=/tmp/zabbix_agentd.log
Server=127.0.0.1
ServerActive=127.0.0.1
Hostname=Zabbix server
Here is the new file with our configuration.
LogFile=/tmp/zabbix_agentd.log
Server=127.0.0.1,200.200.200.200
ServerActive=200.200.200.200
Include=/usr/local/etc/zabbix_agentd.conf.d/
In our example, the Zabbix agent is configured to allow the connection from the Zabbix server 200.200.200.200.
The Zabbix server with the IP address 200.200.200.200 is allowed to request and receive information from this agent.
The Localhost, 127.0.0.1, is allowed to request and receive information from the agent.
Create the directory zabbix_agentd.conf.d.
# mkdir /usr/local/etc/zabbix_agentd.conf.d -p
Copy the file named userparameter_mysql.conf from the Zabbix installation package to the zabbix_agentd.conf.d directory.
# cd /downloads/zabbix-4.0.3/conf/zabbix_agentd
# cp userparameter_mysql.conf /usr/local/etc/zabbix_agentd.conf.d/
Create the required Zabbix agent MySQL credentials file.
The Zabbix agent will use this information to connect the MySQL server.
# mkdir /var/lib/zabbix -p
# vi /var/lib/zabbix/.my.cnf
Here is our configuration.
[client]
user = zabbix_monitor
password = kamisama123
host = localhost
In our example, the Zabbix agent will monitor the MySQL service installed on the localhost.
Restart the Zabbix Agent.
# /etc/init.d/zabbix-agent restart
3. Zabbix Monitor MySQL
Now, we need to access the Zabbix server dashboard and add the Linux computer running MySQL as a Host.
Open your browser and enter the IP address of your web server plus /zabbix.
In our example, the following URL was entered in the Browser:
• http://200.200.200.200/zabbix
On the login screen, use the default username and default password.
• Default Username: Admin
• Default Password: zabbix
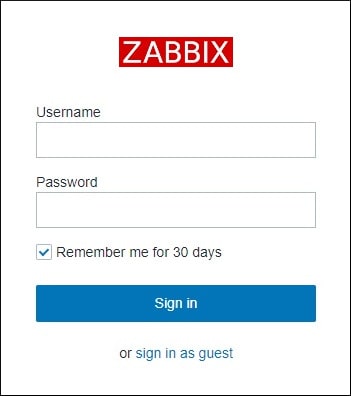
After a successful login, you will be sent to the Zabbix Dashboard.
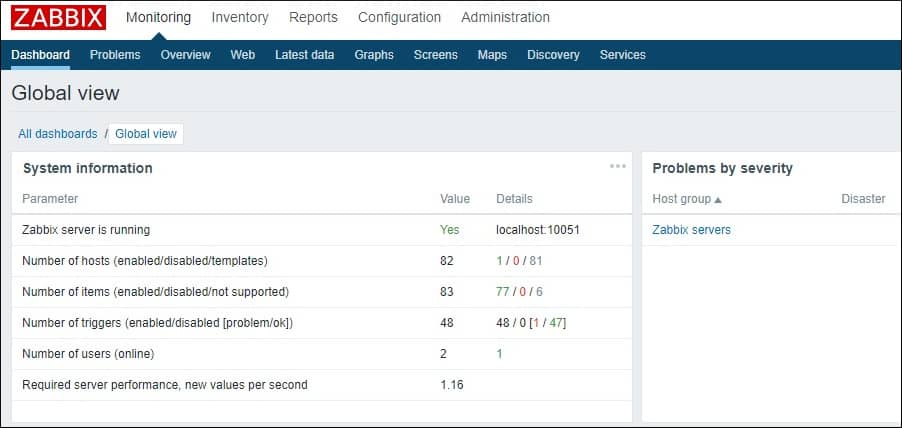
On the dashboard screen, access the Configuration menu and select the Host option.

On the top right of the screen, click on the Create host button.
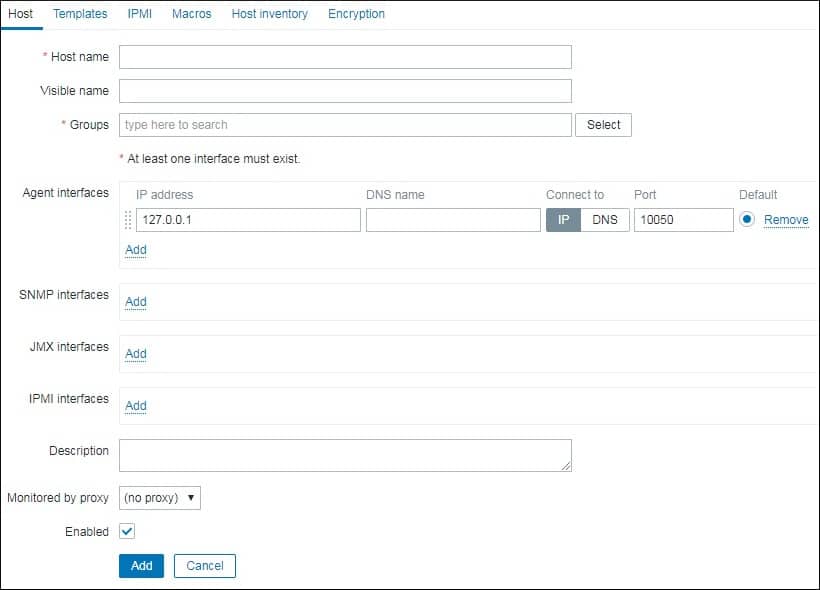
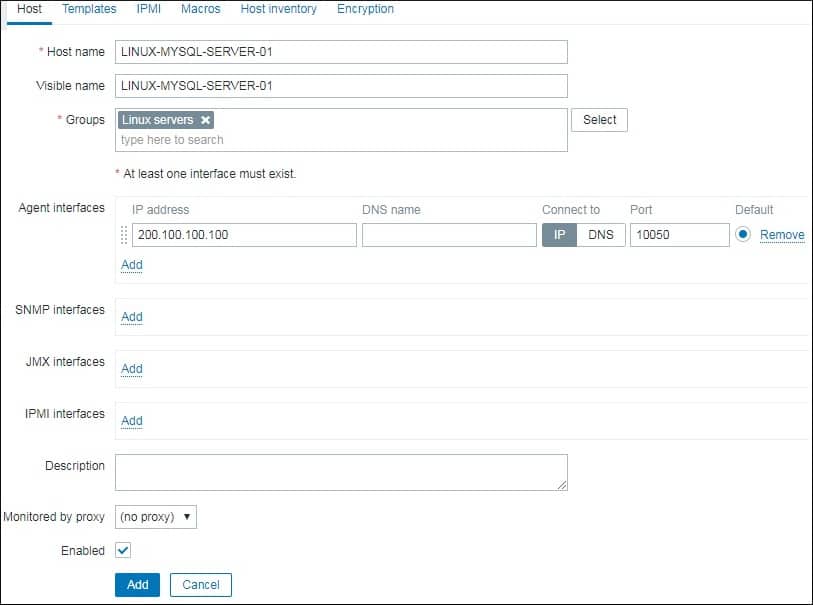
Enter the following information:
• Host Name – Enter a Hostname to identify the Linux server running MySQL.
• Visible Hostname – Repeat the hostname.
• Group – Select the name of a group to identify similar devices.
• Agent Interface – Enter the IP address of the Linux server.
Here is the original image, before our configuration.
Here is the new image with our configuration.
Next, we need to associate the host with a specific network monitor template.
By default, Zabbix comes with a large variety of monitoring templates.
Access the Templates tab on the top of the screen.
Click on the Select button and locate the template named: Template DB MySQL
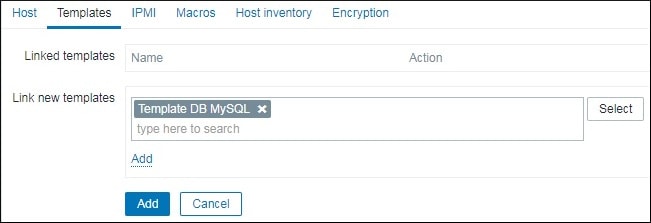
Click on the Add option.
Click on the Add button.
After a few minutes, you will be able to see the initial result on the Zabbix Dashboard.
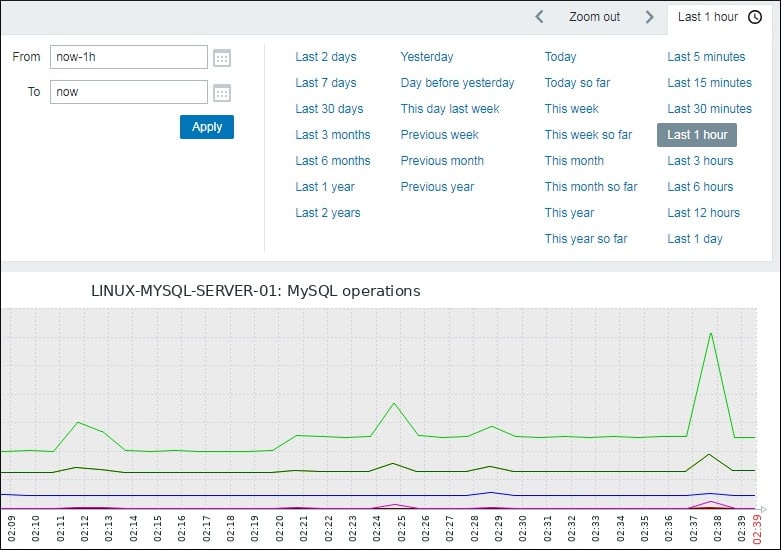
In order to test your configuration, access the Monitoring menu and click on the Graphs option.

On the top right of the screen, select the group named ALL.
Select your MySQL computer hostname.
Select the graph named: MySQL Operations.
You should be able to see the graphic of CPU utilization.
Congratulations! You have configured the Zabbix server to monitor MySQL.

Leave A Comment
You must be logged in to post a comment.